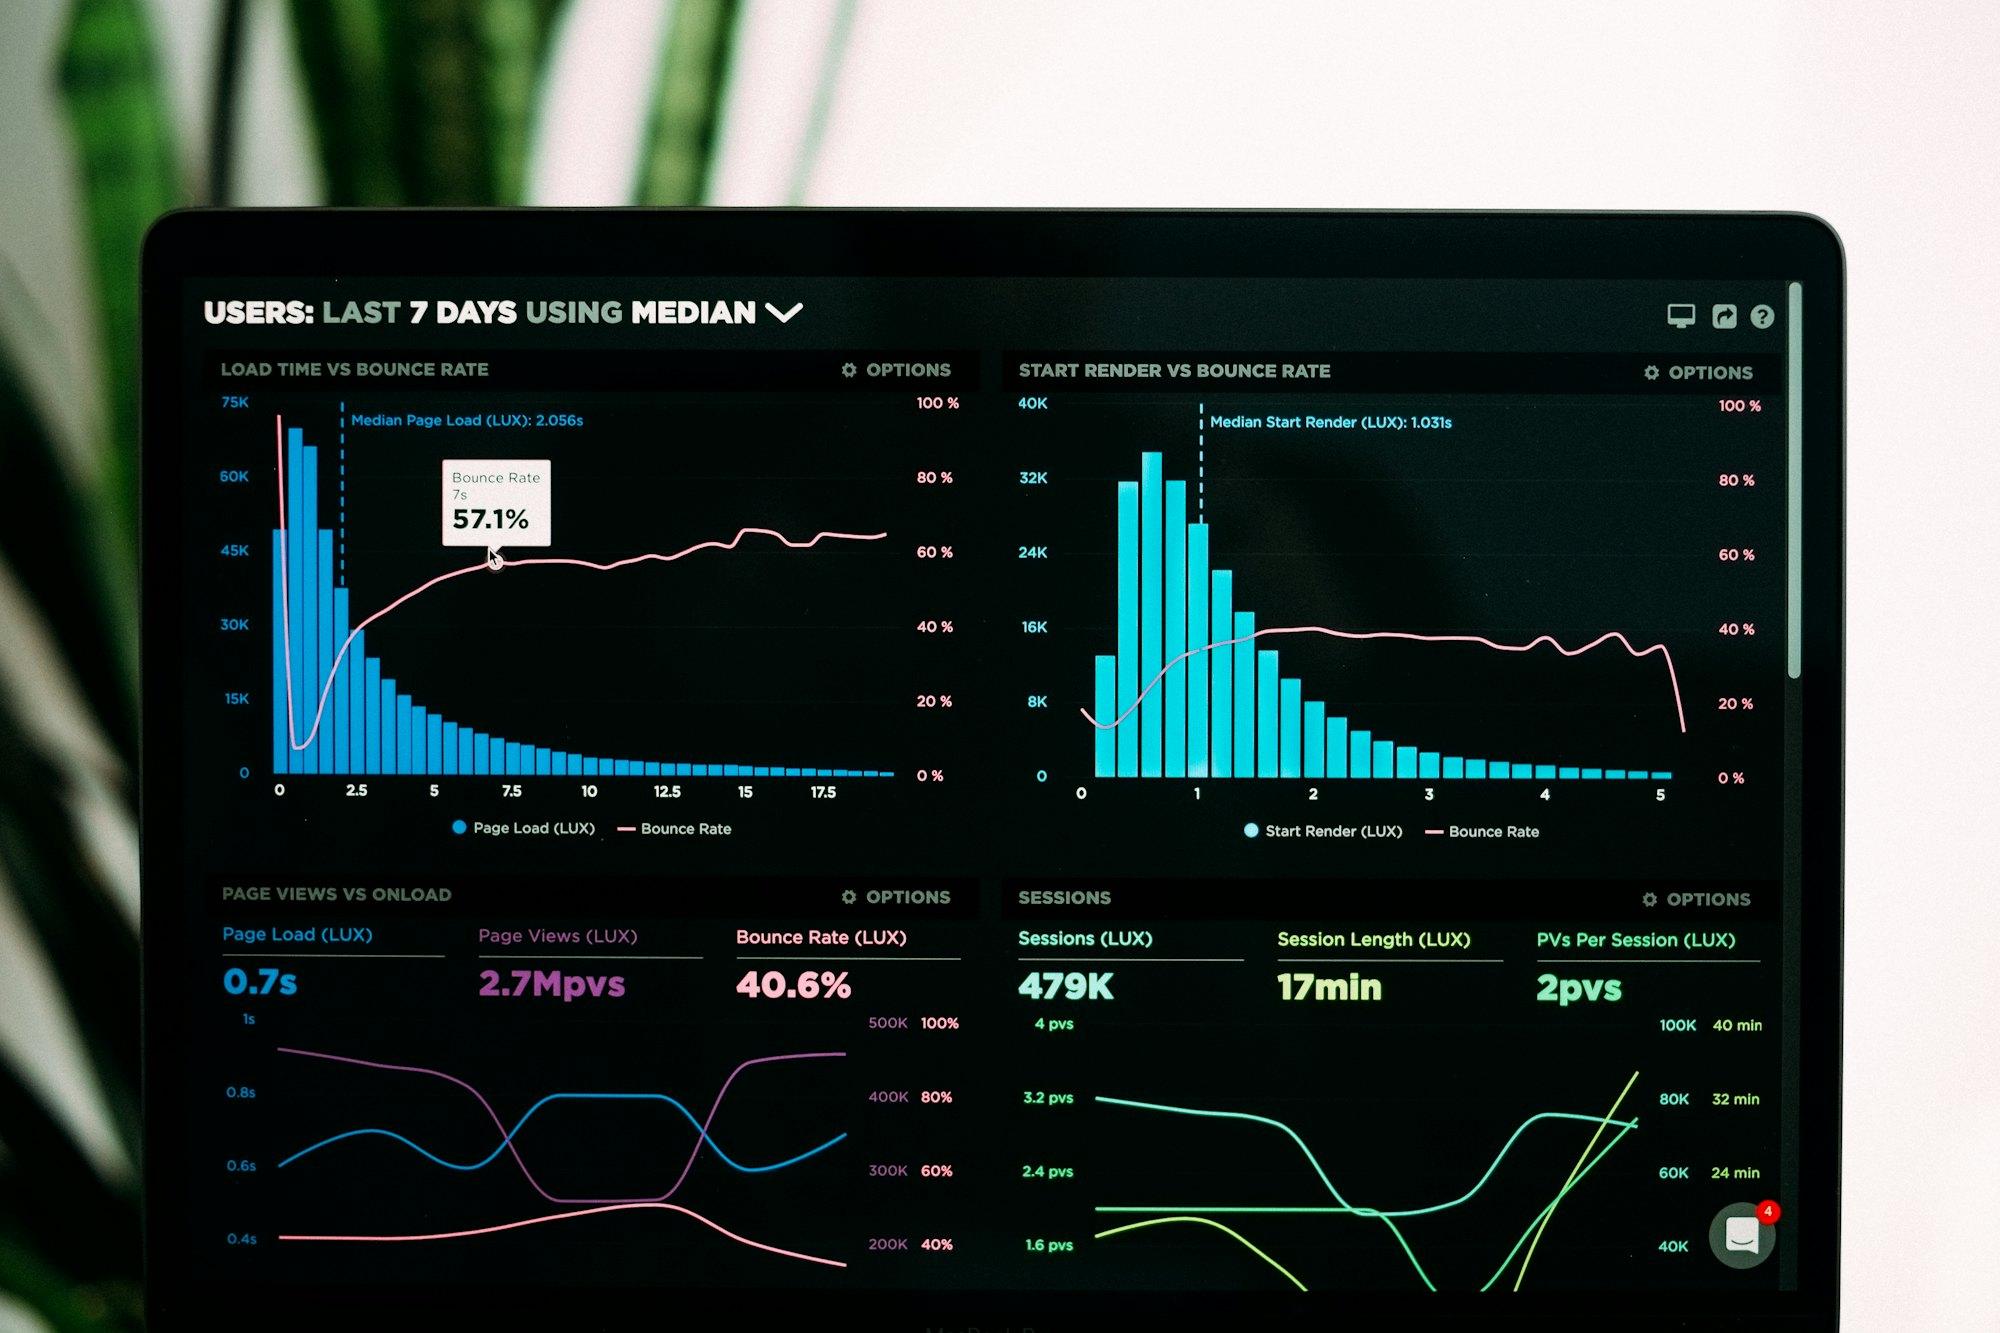
Most owners know their site feels slow on a phone and have no idea why. Core Web Vitals are Google's attempt to put three common frustrations into measurable terms: waiting for the main content, tapping something that does not respond, and watching the page jump as you read it.
You do not need to read performance reports to use them. You need to know what each metric describes, where to see your real numbers, and which handful of causes account for most failures.
The three metrics, without the jargon
Largest Contentful Paint (LCP) measures how long it takes for the biggest visible element, usually a hero image or a headline block, to appear. Google's threshold for a good score is 2.5 seconds or less. It is the closest thing to “how long before this page looks loaded”.
Interaction to Next Paint (INP) measures how quickly the page responds when someone taps, clicks or types. A good score is 200 milliseconds or less. A poor INP is that feeling of tapping a menu button and nothing happening for a moment, so you tap again.
Cumulative Layout Shift (CLS) measures unexpected movement. A good score is 0.1 or less. It is the reason you tapped “Cancel” when the button moved and “Pay now” landed under your thumb instead.
Why this is a business problem and not a developer problem
A slow or jumpy page costs you at the exact moment someone is deciding whether to trust you. Product pages that take too long to show an image lose people before the price is read. Forms that lag when typed into lose people at the last step. None of this appears in a keyword report. It appears as a vague sense that traffic is fine and conversions are soft.
Core Web Vitals are also a Google ranking signal, but a modest one. Relevance and content still carry most of the weight. Fixing vitals will not rescue a thin page. It will stop a good page being held back by a poor experience, and that is a more honest way to describe the benefit.
Speed work pays for itself on pages that already have traffic and intent. Fix those first, not the whole site.
Look at real-user data before lab tests
There are two kinds of measurement. Lab tests, such as running Lighthouse in a browser, simulate one visit on one device. Field data comes from real visitors on their real phones and networks. Google judges you on field data, so start there.
The Core Web Vitals report in Search Console groups your URLs into good, needs improvement and poor, using field data. PageSpeed Insights shows the same data for a single URL, alongside lab diagnostics. Use field data to find which pages and which metric are failing, then use lab tests to work out why.
Be aware that field data takes weeks to update after a fix, and that low-traffic pages may have no field data at all. That is not an error, just a limit of the dataset.
The usual culprits
Performance problems tend to repeat across sites. Before commissioning a rebuild, check whether one of these is the cause, because most are fixable on the existing site.
- Oversized images: a 4000-pixel photo served to a phone, uncompressed, with no modern format. This is the most common cause of poor LCP.
- The hero image loaded lazily or late, so the browser discovers it only after scripts run
- Third-party scripts: chat widgets, tag managers loaded with too many tags, heatmaps, review badges, ad pixels. Each one is small, and together they dominate INP.
- Web fonts that block text or swap late, causing both slow rendering and layout shift
- Images, embeds and ads without reserved dimensions, which is the classic cause of CLS
- Heavy page builders and plugins shipping large amounts of unused CSS and JavaScript
- Slow server response, often cheap shared hosting or uncached pages
How to fix without breaking things
Change one class of problem at a time and re-measure. Compress and resize images first, because the gain is large and the risk is low. Then audit third-party scripts: for each one, ask who uses it, what decision it informs, and whether anyone has looked at it this quarter. Remove what nobody can justify.
Reserve space for anything that loads late. Give images and embeds explicit width and height, and keep banners and consent notices from pushing content down after it has painted.
Know the limits. If the platform itself is the bottleneck, such as a theme that cannot be made lighter, tuning will plateau and you may need to change the template or stack. That is a decision to make with evidence, not as the first reaction to a red score.
A perfect score is not the goal. Passing on the pages that earn revenue, on real phones, is.
Takeaways
- LCP is loading, INP is responsiveness, CLS is stability. Good is 2.5 seconds, 200 milliseconds and 0.1.
- Use field data in Search Console to find failing pages, then lab tools to diagnose them.
- Images, third-party scripts, fonts and unreserved space cause most failures.
- Prioritise pages with traffic and commercial intent over a sitewide sweep.
- Vitals are a modest ranking factor and a real experience factor. Treat them as both.
Related services